SD-WAN Statistics 2024: Unravelling the Market Trend in the World of Software-Defined Networking
▶ What is the current state of the SD-WAN market
▶ How is the market expected to evolve by 2023
▶ What are the key statistics and data driving SD-WAN adoption
▶ How does SD-WAN impact wide area network (WAN) market dynamics
▶ Why is SD-WAN gaining prominence and altering network management practices
Top SD-WAN Statistics “Infographic”
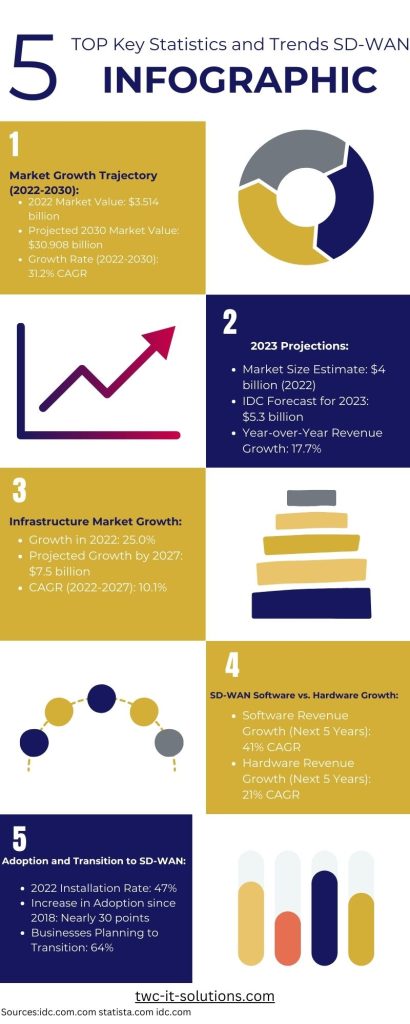
Infographic SD-WAN Stats
What is the current state of the SD-WAN market?
▶Adoption and Security: Adoption rates are varied, with 7% of respondents utilising SD-WAN for security solutions and 14% in the pilot stage. By 2024, over 60% of SD-WAN customers are expected to adopt the SASE (Secure Access Service Edge) architecture for cloud applications (Ordabayeva et al., 2021).
▶Technological Momentum: SD-WAN is gaining significant momentum, especially as distributed cloud technology evolves. This evolution calls for innovative network technologies that emphasise virtualisation, automation, ultra-high data-forwarding performance, and stringent network security (Kim et al., 2018).
▶Benefits for Enterprises: SD-WAN is increasingly recognised as the most promising solution for next-generation enterprise networks, offering enhanced network agility and cost reduction (Troia et al., 2022).
▶Bandwidth and Management: SD-WAN offers more than double the bandwidth with the same backhaul, providing improved manageability, autonomy, and security in enterprise networks (Ghosh, Iqbal, & Dagiuklas, 2021).
Global SD-WAN market size and share
The global market for Software-Defined Wide Area Network (SD-WAN) is witnessing considerable growth. A recent study reveals that the SD-WAN market, valued at USD 3,141 million in 2019, is forecast to surge to approximately USD 10,613.87 million by 2025. This represents a Compound Annual Growth Rate (CAGR) of 22.49% (Palmo et al., 2021). Such a growth trajectory underscores the escalating adoption and burgeoning interest in SD-WAN technology across diverse market segments.
SD-WAN technology is acclaimed for its capability to enhance operations across Wide Area Networks (WANs) through cloud-based management and automation, presenting clear benefits over conventional WAN technologies. It facilitates differentiated services over public WANs and offers resource optimisation advantages for enterprises, likely a key driver of its market expansion (Rajagopalan, 2020).
Market analysis and statistics
Market Size, Growth, and Key Market Players
▶The SD-WAN market, valued at $3,514.6 million in 2022, is projected to escalate to $30,907.6 million by 2030, exhibiting a growth rate of 31.2% during the period 2022–2030. (source)
▶Additionally, the market size, estimated at USD 4 billion in 2022, is anticipated to expand at an impressive CAGR of over 65% from 2023 to 2032. (source)
Key Drivers
▶This surge in growth is primarily attributed to the swift transition from conventional SD-WAN solutions, increased adoption of digitalisation, significant investment in cloud computing technologies, heightened awareness of cybersecurity threats, and the burgeoning need for centralised network management systems.
▶Furthermore, the emergence of the 4G network, MPLs, and LTE is expected to further propel market growth. Additionally, the swift shift of organizations towards cloud-based applications is fuelling the demand for these platforms, offering a cost-effective approach to managing network assets.
Challenges
▶However, concerns regarding data security are impeding the growth of the software-defined wide area network market. Network security remains a paramount concern when opting for an SD-WAN solution.
SD-WAN market statistics by region
Asia-Pacific (APAC): APAC is projected to experience the fastest growth during the forecast period. The growth in this region is attributed to increasing IT spending, government initiatives for the adoption of 5G connectivity in countries like China, India, and Japan, rapid digital transformation, and the expansion of business by key players.
Europe: Europe is set to be the second-fastest-growing region over the forecast period. The growth drivers include rising internet penetration, demand for advanced networking solutions from enterprises, adoption of IoT and connected devices in manufacturing facilities, and strategic initiatives by European governments to boost their economies.
Latin America (LATAM): LATAM is expected to register moderate growth, driven by the rising demand for network security, visibility, and management by enterprises, the increasing number of cyberattacks in countries like Brazil and Mexico, and the overall pace of digitization in the region.
Middle East and Africa (MEA): While specific growth figures for MEA are not provided, the region is likely to see development in the SD-WAN market, possibly driven by increasing digital transformation and investment in IT infrastructure. (source)
SD-WAN market growth and trends
▶Simultaneously, the market size, estimated at USD 4 billion in 2022, is projected to experience a robust growth of over 65% CAGR from 2023 to 2032. (source)
▶Additionally, the SD-WAN infrastructure market witnessed a growth of 25.0% in 2022. It is expected to continue growing at a compound annual growth rate of 10.1%, reaching $7.5 billion by 2027. (source)
▶For 2023, IDC anticipates a year-over-year revenue growth of 17.7% to $5.3 billion, a slight decrease from the 21.5% revenue growth observed in 2022. (source)
Key Drivers
▶The growth of the market is largely attributable to a rapid shift from traditional SD-WAN solutions, increasing adoption of digitisation, significant investment in cloud computing technologies, heightened awareness of cyber threats, and an escalating need for centralised network management systems. (source)
▶Furthermore, the prominence of 4G networks, MPLs, and LTE is expected to further bolster market growth. Additionally, the rapid transition of organisations towards cloud-based applications is spurring demand for cloud-based platforms, as they offer a cost-effective means of managing network assets. (source)
Challenges
▶However, concerns regarding data security are curtailing the growth of the software-defined wide area network market. Network security is considered the most significant drawback in the adoption of SD-WAN solutions. (source)
Key players in the SD-WAN market
Other prominent entities in the SD-WAN market include Fortigate and Flexiwan. Fortigate is renowned for its commercial solutions, which offer robust security mechanisms. Flexiwan, on the other hand, provides open-source solutions known for their adaptability to future threats (Rodríguez Bustamante & Avila-Pesantez, 2021).
1. Cisco Systems:
▶The Gartner SD-WAN Equipment Market Share Report ranks Cisco as the leading entity, highlighting its prominent position in the market. (source)
▶In Q2 of 2019, Cisco held a market share of 16.2%, demonstrating its significant influence in the sector. (source)
▶Cisco is at the forefront of the SD-WAN market, commanding a substantial 37% of the market share. (source)
▶Furthermore, Cisco has captured an impressive 46.4 percent of the total SD-WAN market, underscoring its dominance in this domain. (source)
2. Citrix Systems:
▶Citrix SD-WAN holds approximately 0.1% of the market share, indicating its presence in the SD-WAN market. (source)
Aryaka Networks:
▶In Q3 2017, Aryaka secured an 18 percent share of the global SD-WAN market, demonstrating its significant market presence. (source).
3. Palo Alto Networks:
▶Palo Alto Networks made its entry into the SD-WAN market through the acquisition of CloudGenix in 2020. (source)
4. VMware:
▶In Q4 of 2021, VMware led the market with an 18% share, highlighting its dominant position.(source)
▶VMware holds the number one position in the SD-WAN market share.(source)
5. Peplink:
▶Peplink held a leading position in the Wireless SD-WAN market, capturing a 22% market share based on its 2016 revenue. (source).
Versa Networks:
▶In 2021, Versa Networks was the second-leading SD-WAN vendor, securing a 17% market share in Q4.(source)
How is the market expected to evolve by 2023?
Market size projection for 2023
▶Gartner predicts the SD-WAN market will reach $5.3 billion by 2023. (source)
▶By 2030, the SD-WAN market size is anticipated to reach $30,907.6 million, with a growth rate of 31.2% over the period 2022–2030.(source)
Market share by company type
Market segmentation and growth rate
The SD-WAN market is segmented by:
▶Deployment: Premise, Cloud, and Hybrid (source)
▶Component Type: Solutions and Services (source)
▶Organisation Size: Large Enterprise and Small-Medium Enterprise (source)
▶End-user Industry: Healthcare, Manufacturing, IT and Telecom, Banking and Financial Services, Government, Retail and Consumers Services, Transport and Logistics, and Other End-user Industries (source)
The global Software-Defined Wide Area Network (SD-WAN) Market is projected to expand from USD 3.4 billion in 2022 to USD 13.7 billion by 2027. This growth represents a Compound Annual Growth Rate (CAGR) of 31.9% during the forecast period. (source)
Key factors driving the adoption of SD-WAN
2. Work-from-Home Shift: The shift to working from home, spurred by COVID-19, is hastening the trend of moving applications to the Cloud. Employees working remotely require access to their corporate applications with the same high-quality experience as if they were in the office.
3. Efficient Network Management: Network and IT managers are seeking more efficient methods to manage their networking resources, especially connectivity, Virtual Private Networks (VPNs), and security. SD-WAN enables the seamless and secure functioning of multiple network access points as a single, streamlined networking operation.
4. Global Network Consistency: SD-WAN is particularly beneficial for global corporations with branches and offices in various countries. It uses a centralised control function to securely and intelligently direct traffic across these multiple sites.
5. Improved Application Performance: Network engineers can use a policy engine in conjunction with SD-WAN to assign priorities to different applications. This results in enhanced application performance and, ultimately, increased employee productivity.
What are the key statistics and data driving SD-WAN adoption?
Table: Comparison of Traditional WAN vs SD-WAN
| Aspect | Traditional WAN | SD-WAN |
|---|---|---|
| Focus | Hardware-based, using routers and other physical equipment. | Software-defined approach to managing networks. |
| Configuration | Requires extensive manual configuration. | Simplified and dynamic configuration, often automated. |
| Cost | Can be costly due to hardware, dedicated leased lines, and maintenance. | Often more cost-effective, using less expensive internet connections. |
| Security | Robust security through dedicated leased lines, ensuring private connections. | Enhanced security with integrated features like firewalls and Secure Web Gateways, despite public internet use. |
| Reliability | High reliability with dedicated links. | Dynamic routing improves reliability and reduces dependency on a single link. |
| Control | Complete control over the network with the ability to define routing policies. | Provides flexibility and control with easier management of traffic and improved network visibility. |
| Agility & Flexibility | Limited; scaling and adapting to new technologies can be complex. | Increased agility and flexibility, capable of adapting quickly to changing needs. |
| Performance | Traditional performance, which may not be optimal for cloud traffic. | Improved application performance, optimised for cloud connectivity. |
| Additional Features | Primarily focused on connectivity. | Includes a range of additional features like WAN optimisation, application performance enhancements, etc. |
| Scalability | Scaling can be challenging and expensive. | Easier and more cost-effective scalability. |
| Cloud Support | Might not provide optimal support for cloud-based applications and services. | Optimised for cloud services, supporting the direct connection to cloud applications. |
| Limitations | Costly implementation and maintenance, complex management, limited support for cloud traffic. | Requires a shift in how networks are traditionally managed and secured, reliance on underlying internet connections. |
Comparison of traditional WAN and SD-WAN
▶ Hardware Focus: Traditional WANs were constructed using hardware products, such as routers, to connect geographically dispersed locations.
▶ Manual Configuration: A significant characteristic of traditional WANs is the requirement for extensive manual configurations.
▶ Security: The use of dedicated leased lines ensured robust security and privacy, as no two enterprises shared the same network connection.
▶ Reliability: These dedicated links offered much higher reliability compared to network routing over the public internet.
▶ Control: Traditional WANs afforded organisations complete control over their network, enabling them to define routing policies to prioritise different traffic types and flows.
▶ Limitations: However, traditional WANs could be costly to implement and maintain, difficult to scale, complex in management, and might not provide optimal support for cloud traffic.
SD-WAN:
▶Software Focus: SD-WAN, standing for Software Defined Wide Area Network, represents a software-defined approach to managing Wide Area Networks.
▶Cost-effective: SD-WANs are often more cost-effective than traditional WANs, as they can utilise less expensive internet connections to link geographically dispersed locations.
▶Agility: SD-WANs offer increased agility and flexibility, capable of dynamically routing traffic across multiple network paths.
▶Improved Application Performance: SD-WAN enhances secure application performance, optimises cloud connectivity, and simplifies management.
▶Additional Features: SD-WAN solutions not only provide secure VPNs but also integrate additional features such as firewalls, WAN Optimisation, Secure Web Gateways, and more.
Market statistics and analysis
The SD-WAN market is expected to grow at a Compound Annual Growth Rate (CAGR) of 45.5% from 2020-2025. (source)
This growth is fuelled by several factors, such as the transition to cloud computing, the move towards working from home due to the COVID-19 pandemic, the requirement for efficient network management, and the need for consistent global networking.
On the other hand, traditional WAN technology remains a valid and reliable method for delivering and receiving network services. However, it presents limitations like high costs, lack of agility, challenges in scalability, complexity, and suboptimal support for cloud traffic. As a result, companies reliant on traditional WAN architecture are exploring alternative connectivity options, such as SD-WAN.
In some instances, adopting a hybrid approach that incorporates both traditional WAN and SD-WAN may prove most advantageous. The suitability of such an approach largely depends on the specific needs and circumstances of each organisation. As businesses continue to evolve and adapt to the changing technological landscape, the shift from traditional WAN to SD-WAN is expected to gain momentum.
Adoption and growth trends
▶Traditional WANs have been around for the past 20-25 years.
▶However, they are being replaced by more advanced SD-WAN services.
SD-WAN:
▶SD-WAN has been in the industry for 4-5 years now.
▶In 2022, the installation rate of SD-WAN stands at 47% among respondents, compared to 43% in 2020 and 18% in 2018. This represents an almost 30-point increase since the initial survey conducted in 2018. (source)
▶The proportion of respondents in the Pilot/Roll Out phase has risen by 14%, suggesting that a greater number of enterprises in the research phase have opted for adoption and are currently in the process of implementing the service. (source)
▶Merely 5% of respondents have indicated a lack of intention to adopt SD-WAN. (source)
▶Research indicates that 64% of businesses utilising WANs are planning to transition to SD-WAN solutions, thereby surpassing older WAN models such as MPLS and traditional VPNs. (source)
Market share and growth rate by leading vendors
The SD-WAN market is dominated by a few key players. According to IDC’s most recent Worldwide SD-WAN Infrastructure Market Share report, the top six vendors accounted for 78.3% of the market. (source)
These vendors are also the only ones listed in the “leaders” category in Gartner’s latest Magic Quadrant for WAN Edge Infrastructure (source)
Here are some details:
1. Cisco is at the forefront of the SD-WAN market, commanding a 37% market share. According to IDC, Cisco’s SD-WAN revenues reached $630.3 million in the first half of 2021, marking a 20.3% increase from the same period in 2020. (source)
2. Fortinet: Fortinet stands as another significant participant in the SD-WAN market, receiving high commendations from customers for its Secure SD-WAN solution.
3. Palo Alto Networks: Palo Alto Networks’ Prisma SD-WAN also enjoys high ratings from customers.
4. Versa Networks: Versa Networks is recognised as another leading vendor in the SD-WAN market.
5. VMware: VMware plays a crucial role as a key player in the SD-WAN market.
6. HPE (Aruba): HPE (Aruba) also ranks as a leading vendor in the SD-WAN market.
Gartner predicts that the SD-WAN market will exhibit a compound annual growth rate (CAGR) of 14.6% in end-user spending from 2022 through 2027. (source)
This forecast is based on an estimated market penetration of approximately 60% in 2023. (source) Additionally, Gartner projects that by 2026, 60% of new SD-WAN purchases will be integrated into a single-vendor SASE (Secure Access Service Edge) offering, marking a substantial rise from 15% in 2022. (source)
How does SD-WAN impact wide area network (WAN) market dynamics?
1. Market share and impact on WAN market
2. Evolution of SD-WAN: Over the past decade, the role of SD-WAN has evolved significantly, transitioning from its networking origins to becoming a pivotal cybersecurity solution. This evolution has been propelled by the demand for more efficient and flexible network management, especially in light of increasing cloud adoption and the shift towards remote working.
3. Business Impact: SD-WAN exerts a positive influence on various business aspects. It enhances network capacity, availability, and agility, thus maximising end-user productivity. Additionally, it optimises global connectivity for both fixed and mobile users, bolstering international growth. Moreover, SD-WAN facilitates strategic IT initiatives, including migration to cloud infrastructure and applications.
4. Replacement of Traditional WAN: SD-WAN is supplanting traditional WAN technologies such as MPLS, which previously were the go-to options for maximising uptime and ensuring predictable network behaviour. However, MPLS solutions were costly and faced limitations in terms of capacity and availability. In contrast, SD-WAN enables locations to utilise multiple WAN transports simultaneously, including MPLS, cable, xDSL, or LTE, and dynamically routes traffic based on transport quality and application requirements.
2. Vendor comparison and market dynamics
▶Fortinet: Fortinet stands as another significant player in the SD-WAN market, earning high ratings from customers for its Secure SD-WAN solution.
▶Palo Alto Networks: The Prisma SD-WAN by Palo Alto Networks also enjoys high customer ratings.
▶Versa Networks: Versa Networks emerges as another prominent vendor in the SD-WAN market.
▶VMware: VMware plays a vital role as a key player in the SD-WAN market.
▶HPE (Aruba): HPE (Aruba) is also recognised as a leading vendor in the SD-WAN market.
Regarding growth rates, Gartner projects that the SD-WAN market will experience a compound annual growth rate (CAGR) of 14.6% in end-user spending from 2022 through 2027. This forecast is premised on a market penetration rate of approximately 60% in 2023. Additionally, Gartner anticipates that by 2026, 60% of new SD-WAN acquisitions will be integrated into a single-vendor SASE (Secure Access Service Edge) offering, a substantial rise from 15% in 2022.
In contrast, while traditional WAN technology remains a valid and reliable method for delivering and receiving network services, it is increasingly being superseded by more advanced SD-WAN services. This shift is attributed to traditional WAN’s limitations, such as high costs, a lack of agility, challenges in scalability, complexity, and less-than-optimal support for cloud traffic. (source)
3. Forecast for WAN market growth with SD-WAN adoption
For the period 2021 through 2026, IDC projects a robust Compound Annual Growth Rate (CAGR) of 14.1% for SD-WAN infrastructure. In 2023, IDC predicts a year-over-year revenue increase of 17.7% to $5.3 billion. (source)
A recent report from Futuriom forecasts a compound annual growth rate of 34 percent through 2023. According to Futuriom’s fourth annual SD-WAN Infrastructure Growth report, an impressive 92 percent of organisations are exploring SD-WAN solutions. (source)
In the next five years, SD-WAN software revenue is expected to grow at a 41% compounded annual growth rate, outpacing the 21% growth rate for hardware. The rapid pace of SD-WAN adoption is among the most notable findings of the forecast. (source)
These forecasts signal a significant move from traditional WAN to SD-WAN, propelled by advantages such as cost-effectiveness, agility, enhanced application performance, and the array of additional features offered by SD-WAN.
4. Data center and network management implications
2. Improving Application Performance: SD-WAN enhances application performance and increases agility. It optimises the user experience and efficiency for software-as-a-service (SaaS) and public-cloud applications.
3. Simplifying Operations: SD-WAN streamlines operations through automation and cloud-based management. It simplifies application failover, providing automated failover capabilities.
4. Enhancing Security: SD-WAN maintains high levels of performance for critical applications without compromising security or data privacy.
5. Efficient Resource Usage: SD-WAN improves resource utilisation for multisite deployments. Network administrators can use bandwidth more efficiently and effectively.
6. Infrastructure Management: With SD-WAN, the management of multiple hardware-based routers, firewalls, and other networking devices across various locations becomes less complex. Being software-based, SD-WAN eliminates the need for costly hardware.
Why is SD-WAN gaining prominence and altering network management practices?
Market drivers and growth factors
1. Digital Acceleration: The COVID-19 pandemic has expedited the adoption of digital business models and the development of robust, resilient networks capable of supporting innovative and unpredictable business forms. This shift has triggered a surge in digital transformation investments, with projections suggesting that these could exceed $6.8 trillion between 2020 and 2023. (source)
2. Remote Work: The proliferation of remote work has altered traffic patterns, necessitating new network security services and an enhanced user experience. It is estimated that the proportion of remote workers will double to 34.4% in 2021, up from 16.4% before 2020, and is expected to further increase, with 70% working remotely for at least five days a month by 2025. (source)
3. Network Modernisation: The modernisation of WAN infrastructure has become essential. By adopting SD-WAN, enterprises are able to embrace connectivity solutions that are programmable, scalable, automated, and more efficient.
4. Visibility and Control: SD-WAN provides IT teams with complete visibility of their network through a unified ‘pane of glass’ viewpoint, integrated in the cloud and accessible from anywhere, at any time. This enhanced visibility affords a greater sense of control.
5. Cost Reduction and Improved User Experience: Increasingly, enterprises are turning to SD-WAN as a means to reduce costs, enhance user experience, and strengthen cloud connectivity.
Critical factors driving the adoption of SD-WAN solutions
1. Cost Efficiency: SD-WAN can significantly reduce costs by providing transport independence across various connection types like MPLS, 4G/5G LTE, and others. It can also significantly reduce bandwidth costs.
2. Improved Performance: SD-WAN can improve application performance and increase agility. It optimises the user experience and efficiency for software-as-a-service (SaaS) and public-cloud applications.
3. Simplified Operations: SD-WAN simplifies operations with automation and cloud-based management. It can make application failover seamless and straightforward, offering automated failover capabilities.
4. Enhanced Security: SD-WAN ensures high levels of performance for critical applications without sacrificing security or data privacy.
5. Efficient Resource Usage: SD-WAN can improve resource usage for multisite deployments. Network administrators can use bandwidth more efficiently.
6. Infrastructure Management: With SD-WAN, managing multiple hardware-based routers, firewalls, and other networking devices across various locations becomes less complex. Since SD-WAN is software-based, there’s no need for expensive hardware.
Impact of SD-WAN on corporate network and market status
2. Optimised Global Connectivity: SD-WAN optimises global connectivity for both fixed and mobile users. It allows businesses to utilise cost-effective, last-mile Internet connections within the WAN, ensuring consistent service levels.
3. Enhanced User Productivity: By improving the WAN’s capacity and resilience, SD-WAN maximises end-user productivity.
4. Network Privacy and Visibility: SD-WAN ensures network security and provides comprehensive visibility of the network through a unified ‘pane of glass’ perspective, integrated in the cloud for access from anywhere, at any time.
Relevant IT services for London businesses offered by TWC:
▶ System & CRM Integration Services
Get a Quote within 48 hours
Contact TWC IT Solutions and our dedicated team will address your inquiries and requests, ensuring that you receive the assistance you seek within 48 hours.


IT Awards and Distinctions
110+ IT distinctions in two years.

USA SUPPORT OFFICES:
Los Angeles
New Jersey
ASIA SUPPORT OFFICE:
Hong Kong, China
MIDDLE EAST SUPPORT OFFICE:
Dubai, UAE
UK HEAD OFFICE:
32-34 Station Close
Potters Bar
London
EN6 1TL